SMT Advanced NQ #02 (smooth_hunter)
lb5 · 09:30-11:00 · stop 50 / target 250 pts
Setup KNOBS
| Trial | lb5_one_s09301100_st50tp250_ms1.5_be1_tr0.0_nohtf |
| Pivot lookback | 5 |
| Session window (ET) | 09:30-11:00 |
| Stop / target | 50 / 250 NQ points |
| Min confluence score | 1.5 |
| Breakeven | at 1R |
| Trades per day | 1 |
| Trail / HTF filter | trail off · HTF bias off |
| Comparison symbols | ES / YM (either) · candle validation on |
Curve summary FROM TRADES.CSV
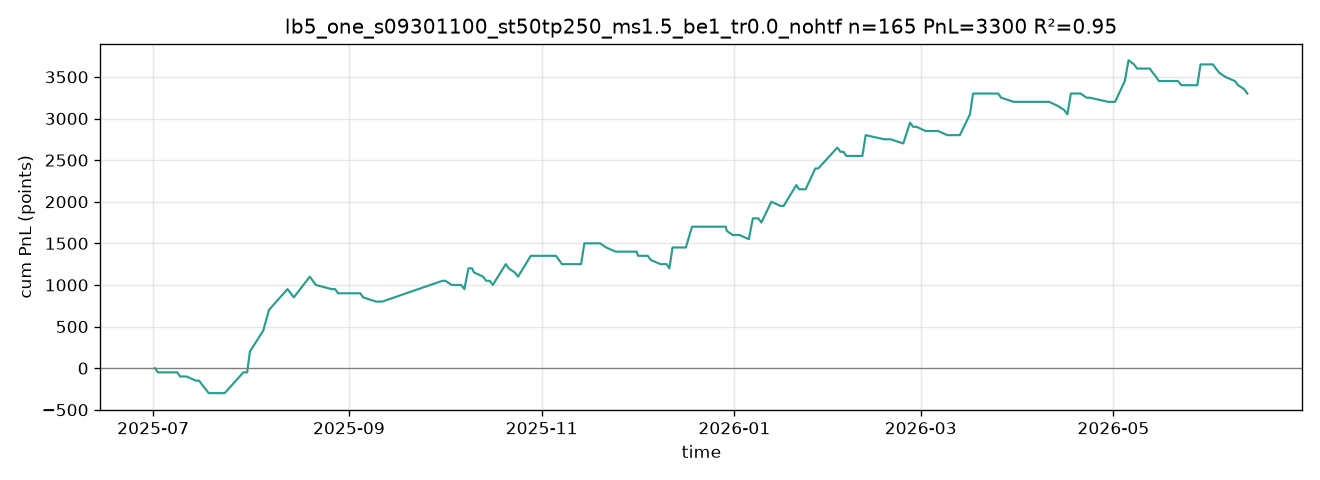
| Final net | +3,300 pts |
| Max drawdown (closed-trade) | 400 pts |
| Shape | steady (R² 0.952, largest win +250 pts) |
| Longest losing streak | 7 trades |
| Top-5-trade share | 19.2% of gross profit · 37.9% of final net |
Curve summary is computed from trades.csv (closed trades, in order). Max DD = largest peak-to-trough of the closed-trade equity. Shape rule: one-trade-dominated if the largest win is ≥ 40% of final net; steady if R² of the equity curve ≥ 0.90 and max DD ≤ 25% of final net; otherwise choppy; a curve with final net ≤ 0 is marked losing. Top-5 share = five biggest winners as % of gross profit (and of final net when net is positive).
Cross-check vs summary.json: all match (trades 165, net +3300, PF 2.03, WR 15.8%, max DD 400). Trade dates come from mapping entry/exit bar indexes onto primary_nq.csv.
Out-of-sample WALK-FORWARD
| OOS result | +700 pts |
| OOS trades · PF · WR | 64 · 1.54 · 12.5% |
| OOS max DD | 400 pts |
| Split | in-sample 189,329 bars · OOS 126,220 bars (OOS from 2026-02-03) |
Data gaps SCAN
Data gaps: 12 weekday(s) without bars, 55 short day(s), 200 intraday hole(s) > 30 min — scanned primary_nq.csv (NQ 1m, inner-joined with ES/YM) over 2025-07-01 → 2026-06-12 ET: missing weekdays 2025-09-15, 2025-09-16, 2025-09-17, 2025-09-18, 2025-09-19, 2025-09-22, 2025-09-23, 2025-09-24, 2025-09-25, 2025-09-26, 2025-09-29, 2026-01-01
← Top six SMT Advanced NQ (All-in-One) · #01 · #02 · #03 · #04 · #05 · #06