All In Setup Hunter 7 · CRT top performers · rank 5 of 7 · /dev
CRT · Test 214
ES · unseen
Test 214, ES, twelve months test, avg trade $1.66, PF 1.01, WR 40.7%, equity curve ↓ · 118 trades · net $196.10
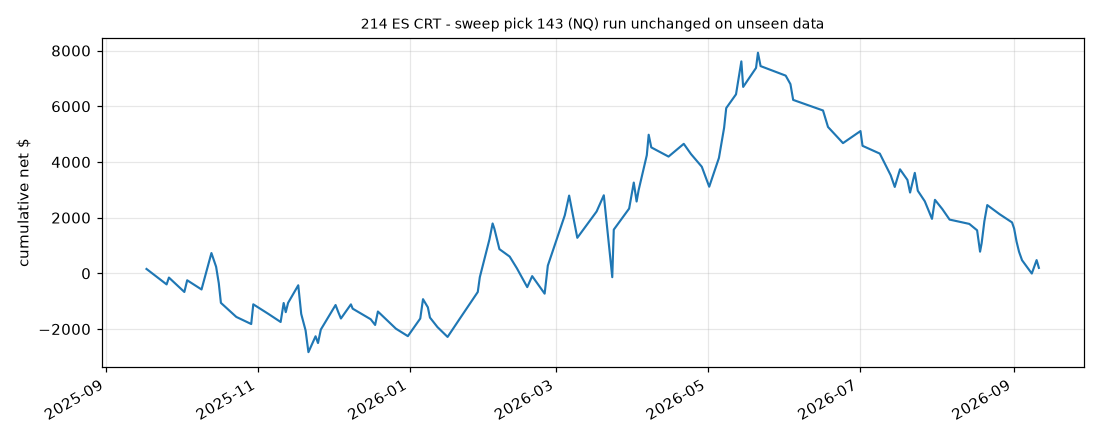
Curve summary FROM TRADES.CSV
| Final net | $196.10 |
| Max drawdown (closed-trade) | $7,930.50 |
| Shape | one-trade-dominated (R² 0.379, largest win $1,807.70) |
| Longest losing streak | 7 trades |
| Top-5-trade share | 21.3% of gross profit · 3793.2% of final net |
Curve summary is computed from trades.csv (closed trades, in order). Max DD = largest peak-to-trough of the closed-trade equity. Shape rule: one-trade-dominated if the largest win is ≥ 40% of final net; steady if R² of the equity curve ≥ 0.90 and max DD ≤ 25% of final net; otherwise choppy; a curve with final net ≤ 0 is marked losing. Top-5 share = five biggest winners as % of gross profit (and of final net when net is positive).
Run's own farm label: Test 214, ES, twelve months test, avg trade $1.66, PF 1.01, WR 40.7% — matches trades.csv.
Run notes METRICS.JSON
| Type | unseen |
| Trade span | 2025-09-17 → 2026-09-11 |
| Note | config = sweep pick test 143 (NQ CRT, chosen on NQ 2025-06-30 22:41:00..2026-09-14 05:58:00); run unchanged on unseen ES |
| OOS (sweep pick OOS) | -$12,859.80 · 41 trades · PF 0.62 · WR 26.8% |
| Params | {"Enabled": true, "crt.Timeframe": 30, "crt.FormWindowStart": "02:00", "crt.FormWindowEnd": "15:00", "crt.EntryWindowEnd": "15:30", "crt.OneCRTPerDay": true, "crt.EntryMode": "LTFBOS", "crt.StopMode": "C2Extreme"} |
Data gaps SCAN
Data gaps: 17 weekday(s) without bars, 28 short day(s), 67 intraday hole(s) > 30 min — ES 2025-09-10 10:00:00 → 2026-09-11 16:59:00 ET (reported by the run)