All In Setup Hunter 7 · CRT top performers · rank 2 of 7 · /dev
CRT · Test 138
NQ · file defaults
Test 138, NQ, eight months test, avg trade $341.98, PF 1.71, WR 48.9%, equity curve ↓ · 45 trades · net $15,389.00
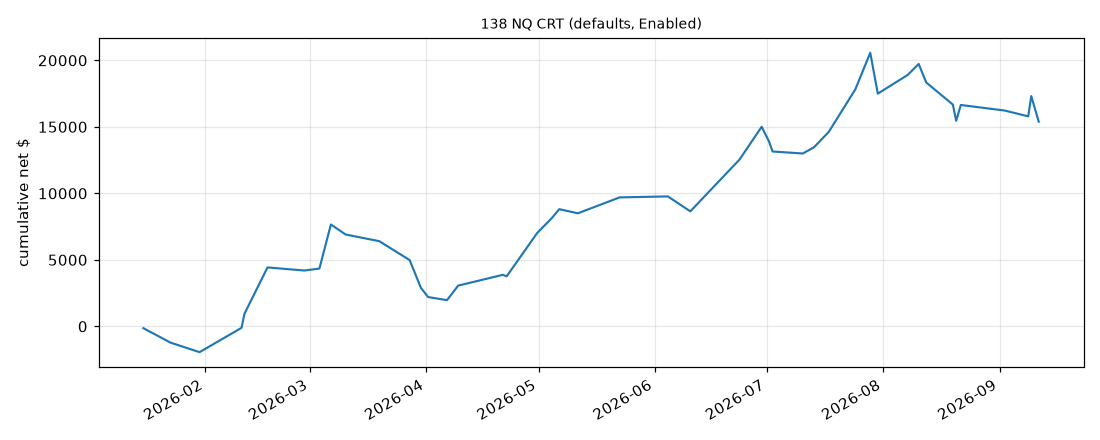
Curve summary FROM TRADES.CSV
| Final net | $15,389.00 |
| Max drawdown (closed-trade) | $5,688.80 |
| Shape | choppy (R² 0.856, largest win $3,905.20) |
| Longest losing streak | 6 trades |
| Top-5-trade share | 46.4% of gross profit · 111.5% of final net |
Curve summary is computed from trades.csv (closed trades, in order). Max DD = largest peak-to-trough of the closed-trade equity. Shape rule: one-trade-dominated if the largest win is ≥ 40% of final net; steady if R² of the equity curve ≥ 0.90 and max DD ≤ 25% of final net; otherwise choppy; a curve with final net ≤ 0 is marked losing. Top-5 share = five biggest winners as % of gross profit (and of final net when net is positive).
Run's own farm label: Test 138, NQ, eight months test, avg trade $341.98, PF 1.71, WR 48.9% — matches trades.csv.
Run notes METRICS.JSON
| Type | file defaults |
| Trade span | 2026-01-15 → 2026-09-11 |
| Note | — |
| Params | "file defaults + Enabled=true" |
Data gaps SCAN
Data gaps: 3 weekday(s) without bars, 9 short day(s), 20 intraday hole(s) > 30 min — scanned NQ 1m source over trade span 2026-01-15 → 2026-09-11 ET